Why I Built This
WhyIBuiltThis
Urban waste management systems often operate reactively — bins overflow before collection, routes are inefficient, and there is little to no data-driven decision-making.
City planners lack visibility into waste generation patterns, making it difficult to optimize collection schedules, reduce costs, or implement sustainable recycling strategies.
Manual waste sorting is inefficient and error-prone, limiting the effectiveness of recycling initiatives.
My Approach
MyApproach
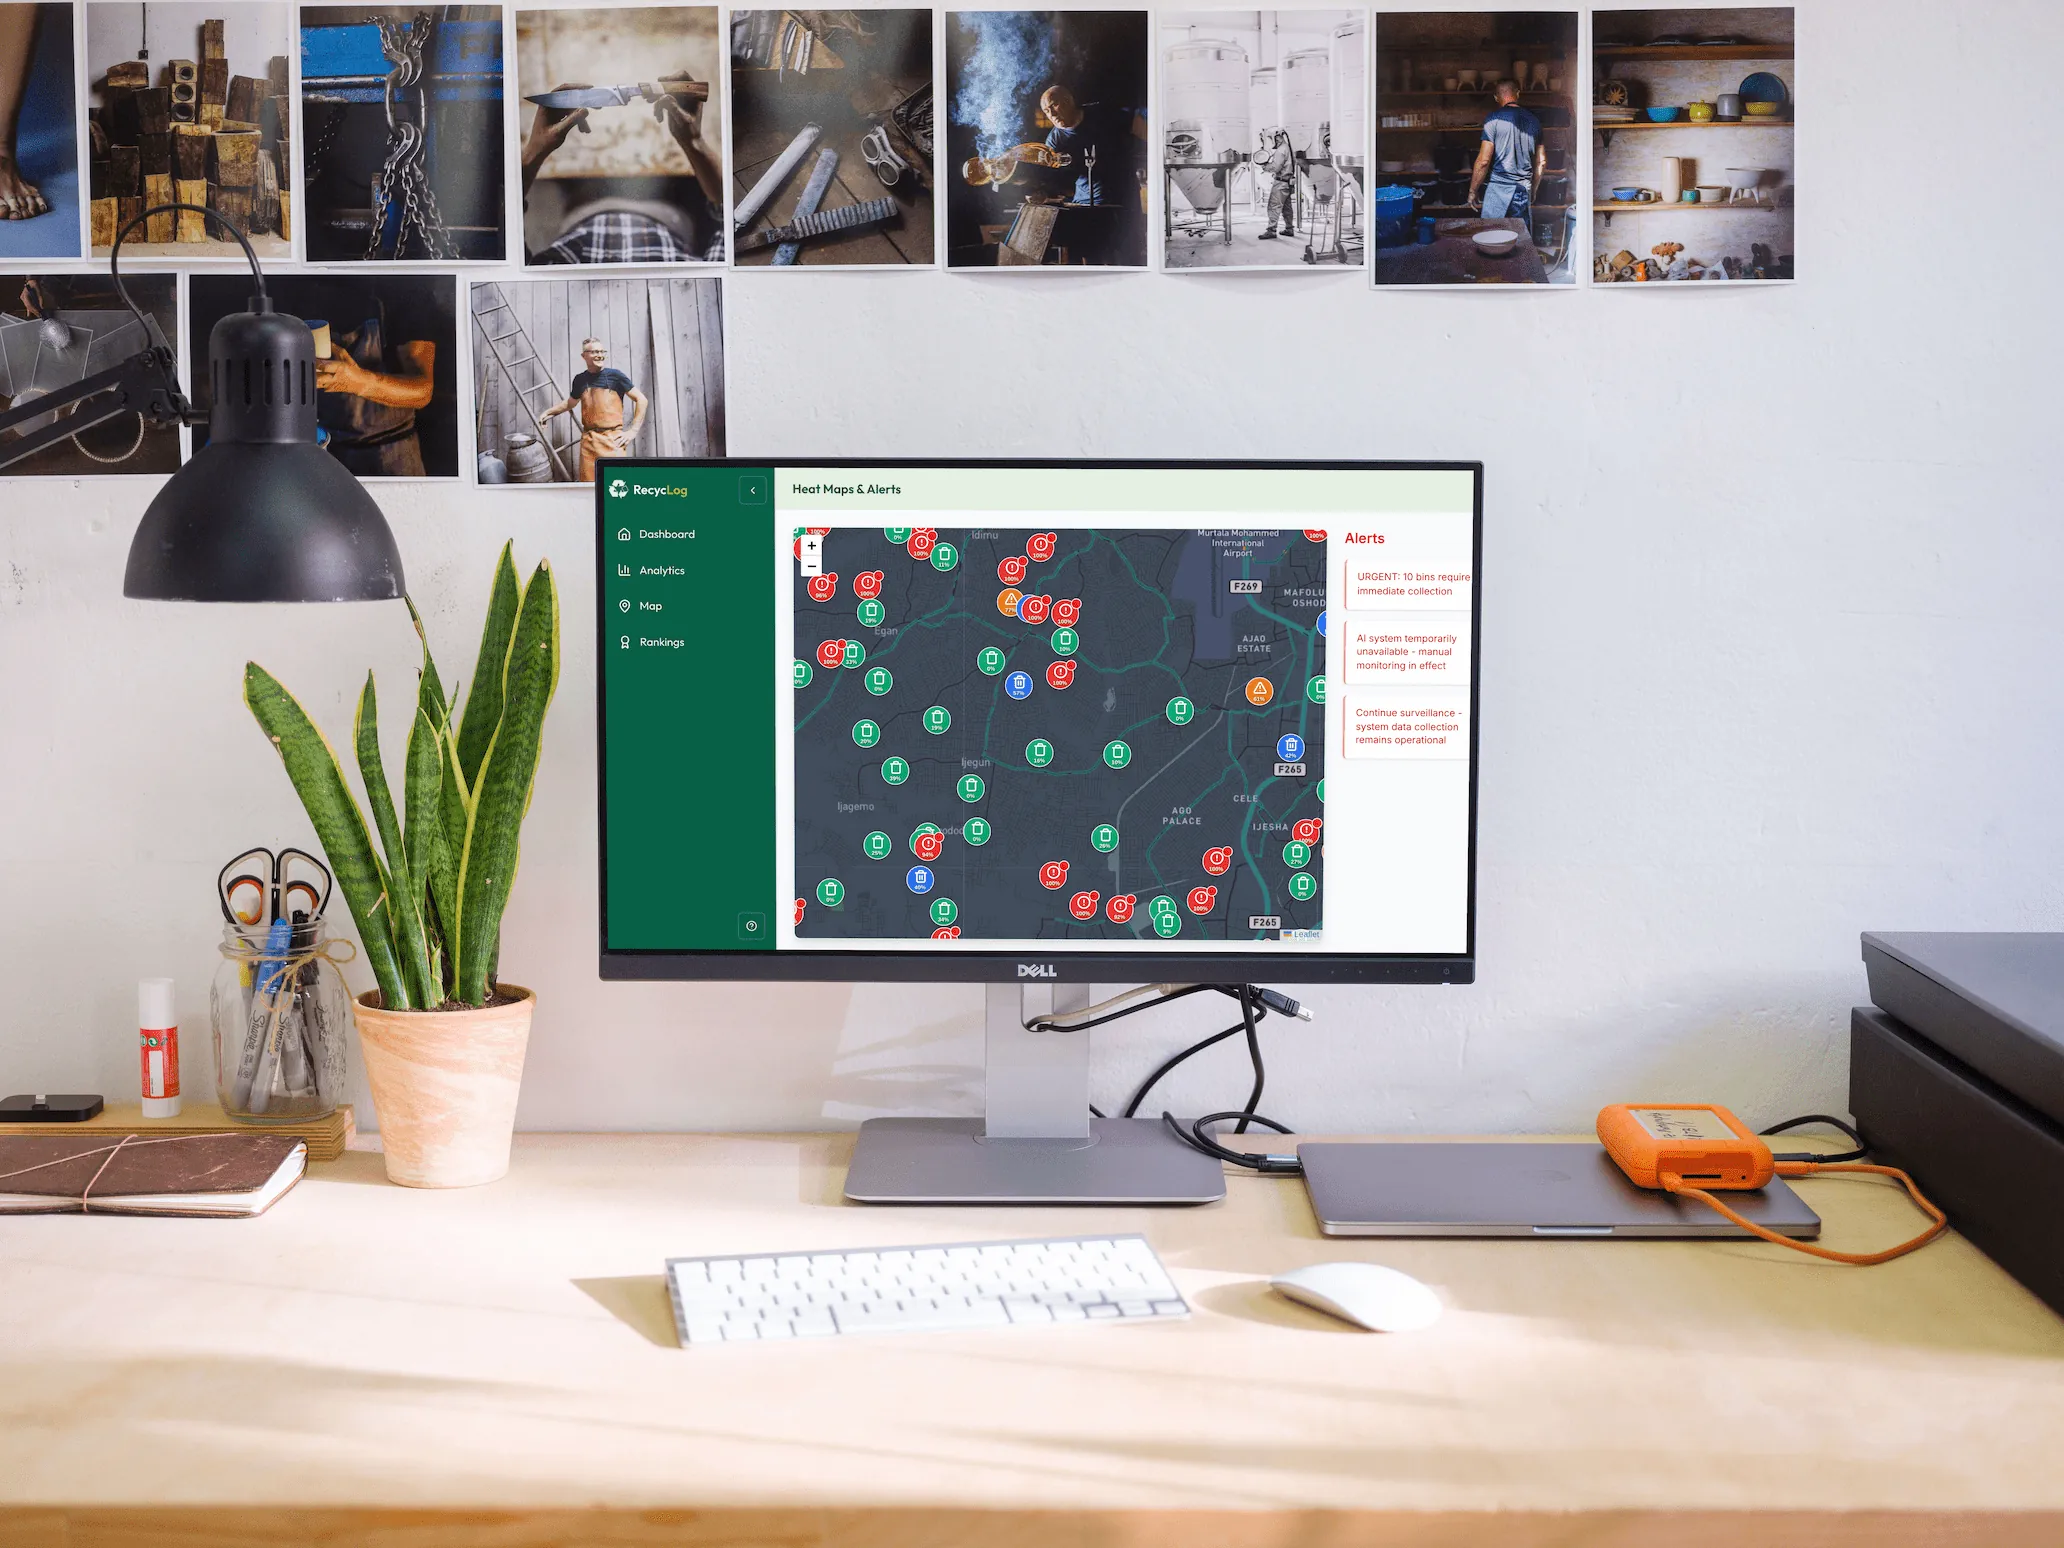
I built a centralized dashboard that aggregates bin-level data and transforms it into actionable insights using AI and data visualization.
The system simulates or ingests real-time bin data, applies classification models to identify waste types, and surfaces trends through heatmaps and analytics dashboards.
By combining prediction models with visual insights, the platform enables proactive waste collection and smarter city-level decision-making.
Key Features
KeyFeatures
- Real-time waste bin monitoring with simulated or IoT-integrated data streams
- AI-powered waste classification for sorting recyclable and non-recyclable materials
- Dynamic heatmaps highlighting high-waste and overflow-prone zones
- Trend analysis and forecasting for waste generation across different regions
- Smart alerts for bin overflow, anomalies, and inefficient collection routes
- Policy recommendation engine suggesting optimized waste management strategies
How the System Works
HowtheSystemWorks
RecycLog AI is designed as a data-driven pipeline that flows from ingestion to insight, combining real-time updates, analytics, and AI-powered predictions into a unified dashboard.
- Waste bin data is ingested either through IoT sensors or simulated data streams representing fill levels, location, and timestamps.
- Incoming data is processed and stored, then fed into analytics services for aggregation and trend computation.
- AI models classify waste types and detect anomalies such as unusual spikes in bin usage.
- A forecasting module predicts future overflow risks and high-demand collection zones.
- The frontend dashboard visualizes this data using charts, maps, and heatmaps for intuitive exploration.
- Smart alerts and recommendations are generated to guide collection scheduling and policy decisions.
Engineering Challenges & Lessons Learned
EngineeringChallenges&LessonsLearned
Designing a realistic simulation for IoT waste bin data that behaves like real-world systems, including irregular fill patterns and peak usage periods.
Balancing real-time updates with performance, especially when rendering heatmaps and analytics dashboards at scale.
Structuring the system to support both simulated data and future integration with real IoT hardware without major refactoring.
Translating raw waste data into meaningful insights and recommendations rather than just displaying metrics.
What I’d Improve Next
WhatI’dImproveNext
- Integrate real IoT devices for live bin monitoring instead of relying on simulated data.
- Enhance the AI models for more accurate waste classification and predictive analytics.
- Introduce route optimization for waste collection trucks using graph algorithms.
- Add user roles for city officials, waste operators, and analysts with tailored dashboards.
- Deploy at scale with real-time streaming infrastructure (e.g., WebSockets, Kafka) for large city datasets.